The ecosystem stack
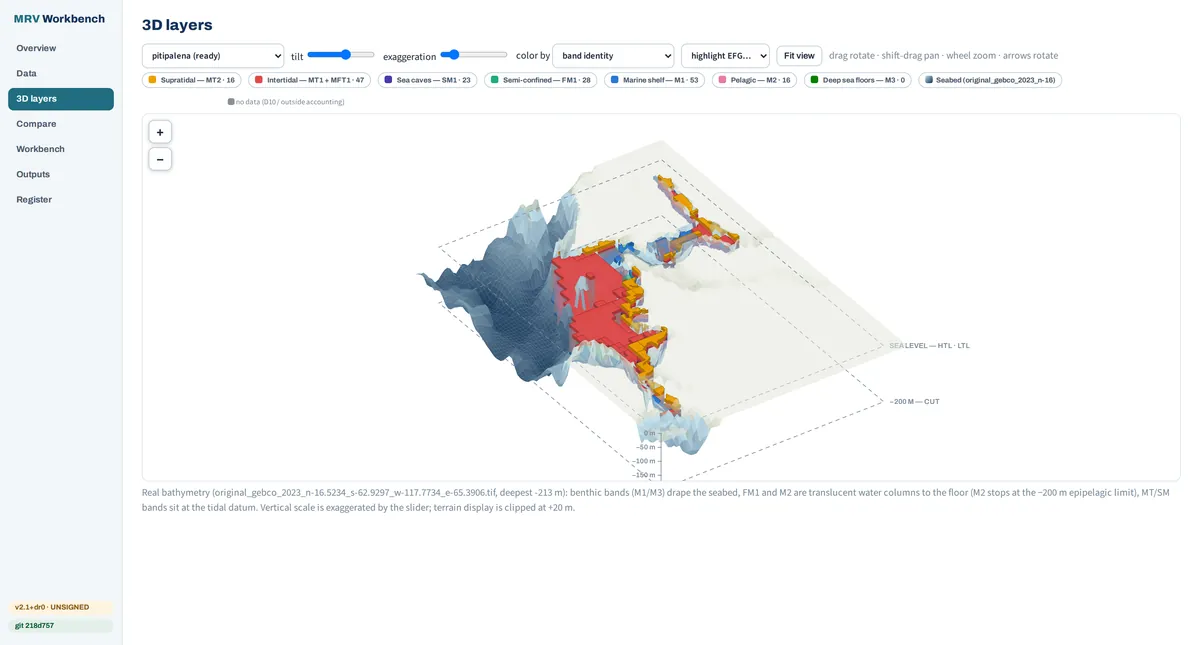
A 30-arc-second grid, cells about a kilometre across, is laid over the site. The ecosystem functional groups of the IUCN Global Ecosystem Typology are stacked in every cell, each at its true depth on ETOPO and GEBCO bathymetry.
Natural Capital Reserve
We rate the marine natural capital of 192 nations and territories, measure what protection delivers at the site, and quantify carbon transition risk in listed portfolios.
01Why now
≈10% protected todayProtected Planet, August 2026
1.3% with management effectiveness assessedIUCN & UNEP-WCMC, 2026
Conserving and sustainably using the ocean is estimated to cost $174 billion a year. Capital on that scale needs a common yardstick: one that compares the marine natural capital of nations, shows what protection actually delivers, and prices the risks that sit alongside it.
“Nature is therefore an asset, just as produced capital (roads, buildings and factories) and human capital (health, knowledge and skills) are assets.”
Source: Dasgupta, P. (2021), The Economics of Biodiversity: Headline Messages.
The Review asks that nature enter economic and finance decision-making in the same way buildings, machines, roads and skills do. Natural Capital Reserve builds the measurement and rating infrastructure to do that for marine natural capital.
02What we build
Nearly two decades of carbon-market ratings taught a simple lesson: capital follows measurement it can trust. We apply that discipline at three scales: the nation, the protected site and the investment portfolio.
03MAAP · Marine Asset Accounting Platform
The investment layer for marine natural capital.
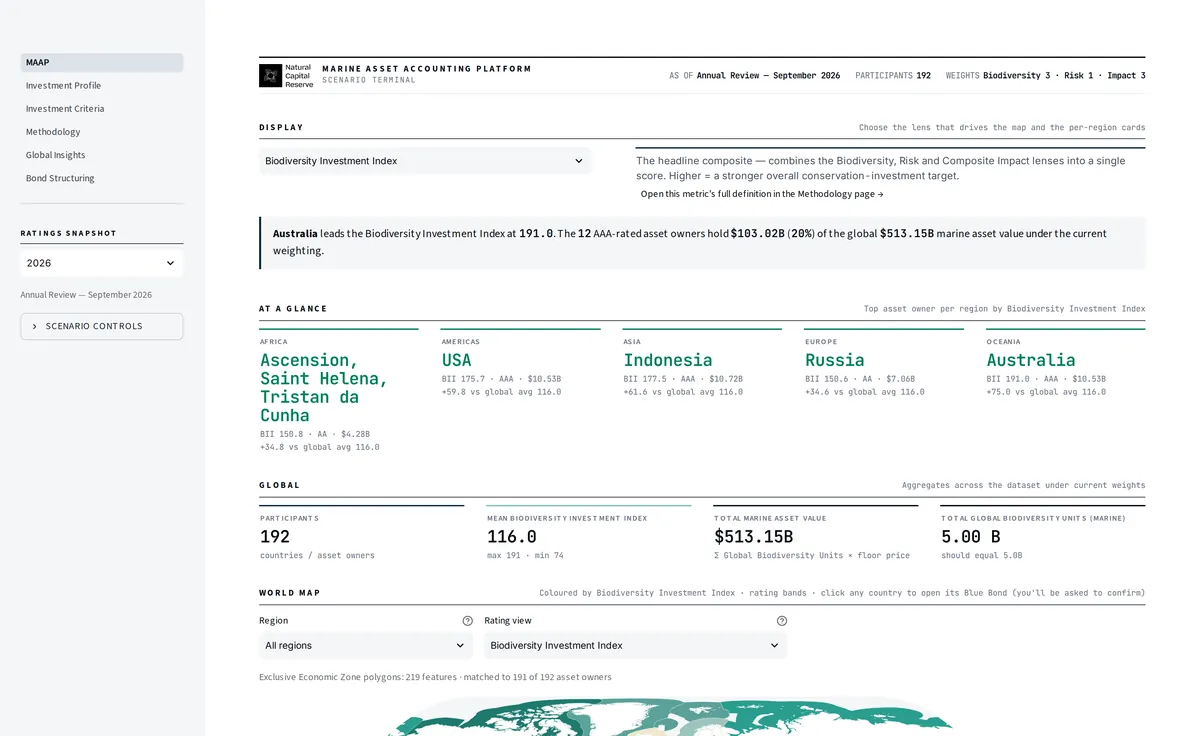
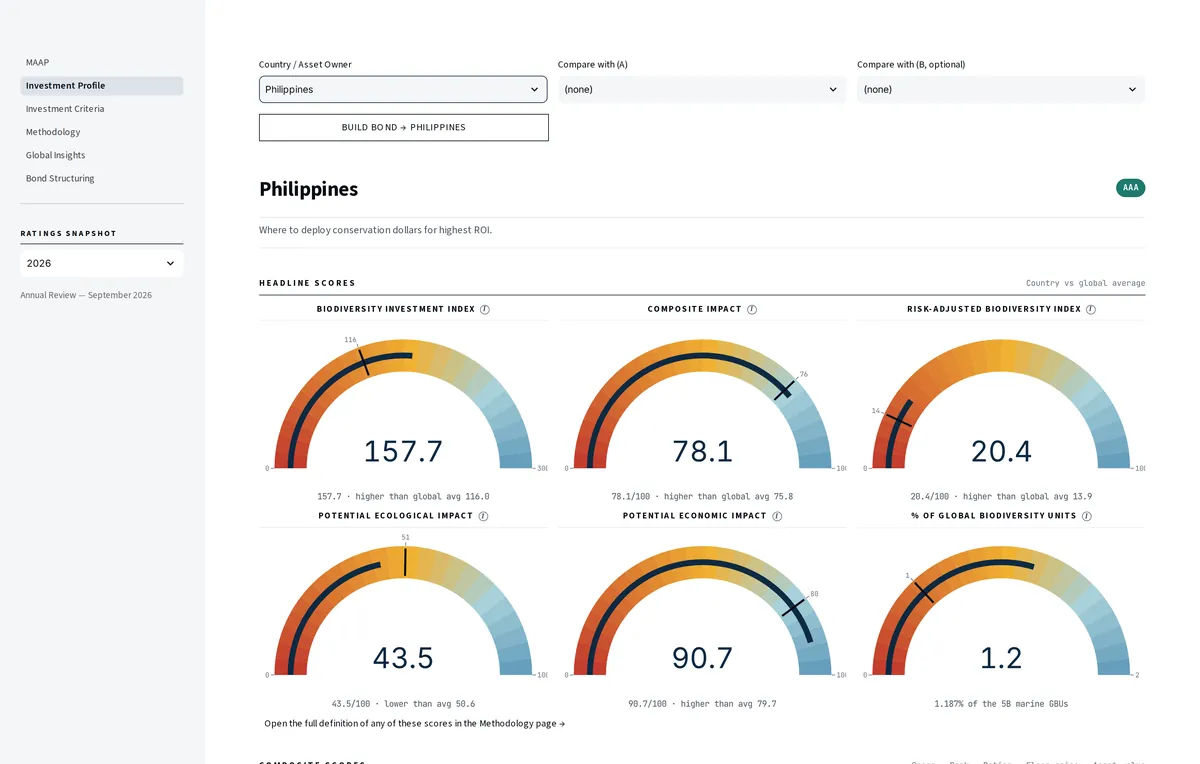
MAAP rates the marine natural capital of 192 nations and territories within their exclusive economic zones, the waters each state governs out to 200 nautical miles. Each jurisdiction receives a grade on a familiar nine-band scale, from AAA to C, rebuilt every year from published, edition-pinned scientific data.
Volume and quality measure the endowment. Pressure is weighed against each jurisdiction’s response. An impact lens asks where a conservation dollar goes furthest. Together they form the Biodiversity Investment Index, graded against fixed thresholds, so a rating moves only when its own evidence moves.
Every input is pinned to a dated edition, so each rating traces back to its source.
04Annual Ratings Study
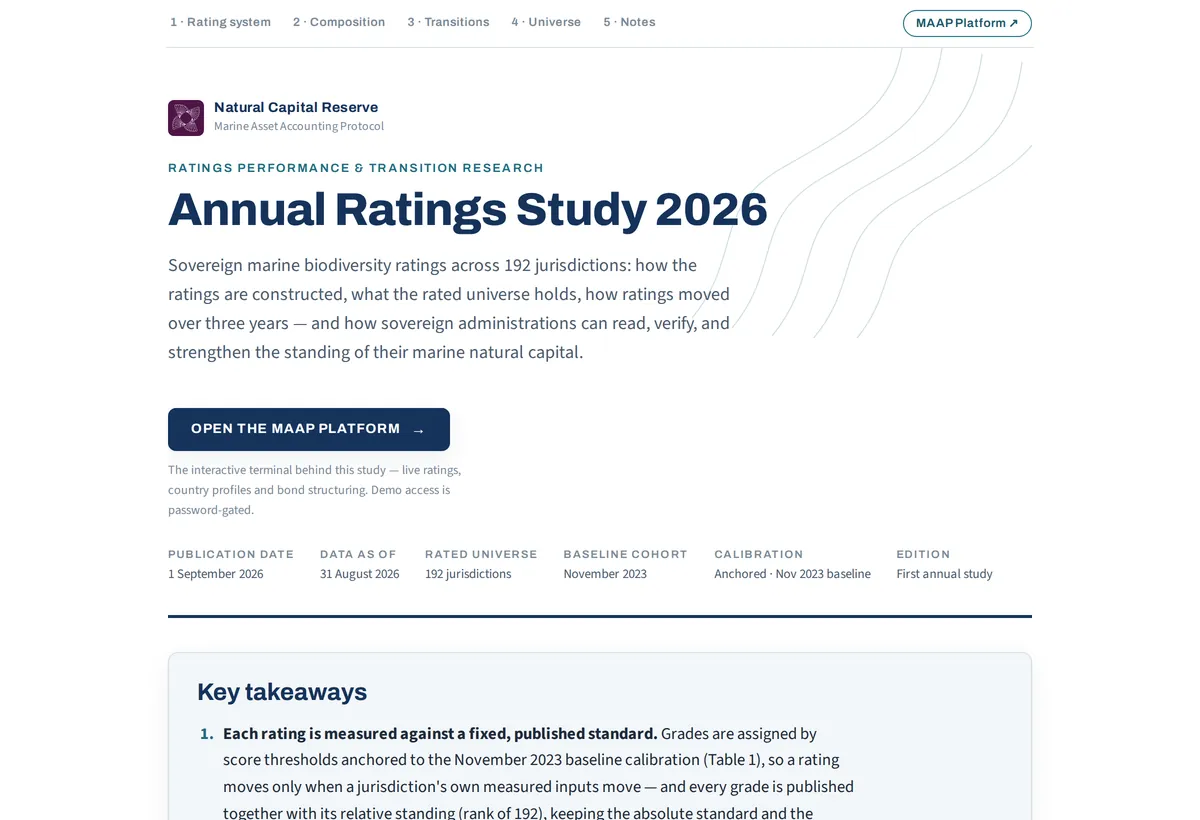
The first annual edition, published 1 September 2026: every rating, every transition since the 2023 baseline and the full methodology. Access on request.
Natural Capital Reserve (2026). MAAP Annual Ratings Study 2026. naturalcapitalratings.com

Measured where conservation happens.
Giant kelp forest · Channel Islands National Marine SanctuaryNOAA Photo Library · public domain
05MRV · Measurement, Reporting & Verification
Where MAAP rates nations, MRV measures sites.
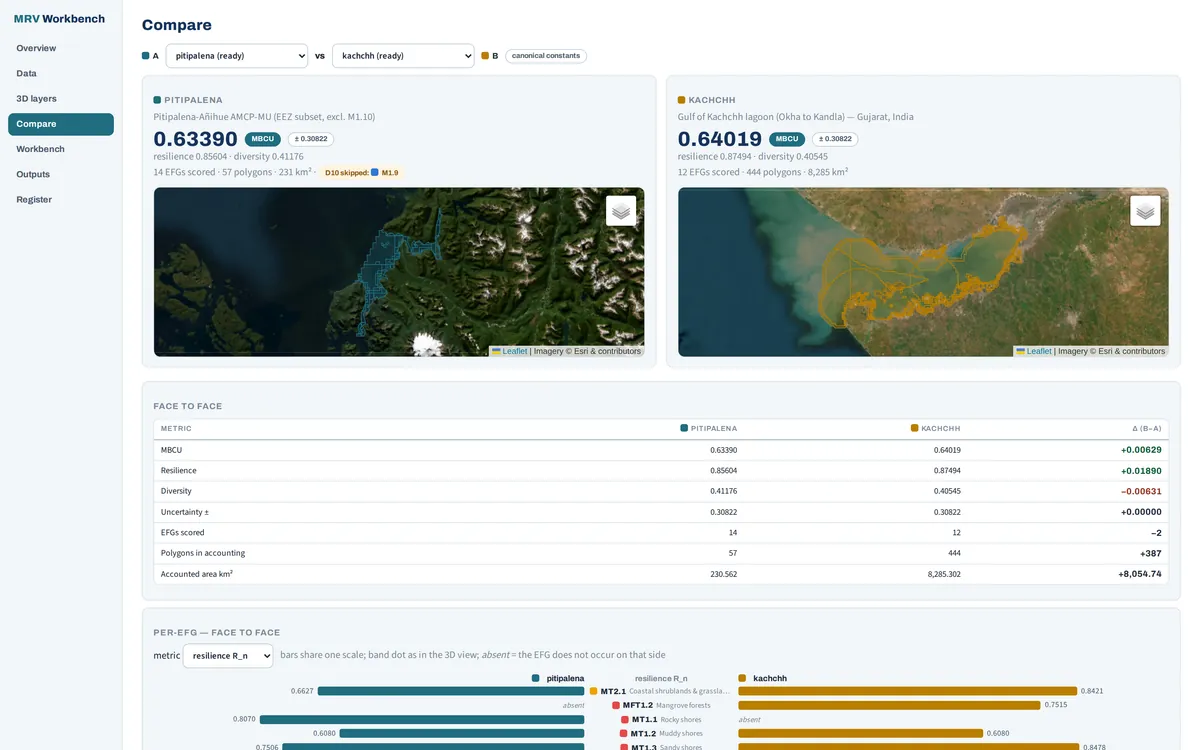
Governments and donors pay to protect marine areas. MRV measures what that protection delivers, in the protected area itself. Its unit is the Marine Biodiversity Conservation Unit (MBCU): a score from zero to one, always reported with its uncertainty.
A 30-arc-second grid, cells about a kilometre across, is laid over the site. The ecosystem functional groups of the IUCN Global Ecosystem Typology are stacked in every cell, each at its true depth on ETOPO and GEBCO bathymetry.
A habitat crosswalk links 31 functional groups to more than 17,000 IUCN Red List taxa, narrowed to those recorded in the site’s region. Population trends and threat status give stability; human pressure, weighted by each species’ sensitivity, gives fragility. Together they give resilience.
Every MBCU carries an uncertainty band built from four sources: Red List data quality, species expected but not yet confirmed, data-deficient species and model error. Every run also states its minimum detectable effect: the smallest real change the system can tell apart from noise.
Observations are matched to the desk inventory through the World Register of Marine Species. Each confirmed species narrows the band, and not seeing a species is never counted as its absence. Field methods: environmental DNA, baited cameras, dive transects and passive acoustics.
MRV builds matched controls: areas in the same country with the same mix of ecosystems, outside the protected area. Both sides are designed to be re-scored as new pressure data arrive, so gains can be credited to protection rather than chance.
Desk-stage pilot scores. Next: formal scientific review and field validation. MRV is designed for outcome-based finance: the uncertainty band would set a holdback, released only as evidence closes the gap.
Browse a site’s ecosystem stack on the map, fly through its layers in 3D and compare two sites side by side. Tune any methodology constant, each tied to a numbered methodology decision, and watch the scores update in a fraction of a second. Then export runs, verification reports and the feed to MAAP. Every run pins its data snapshots, so every number can be reproduced.
06ESL Carbon Spread · EcoSmart Labs
Carbon transition risk, in the language of credit.
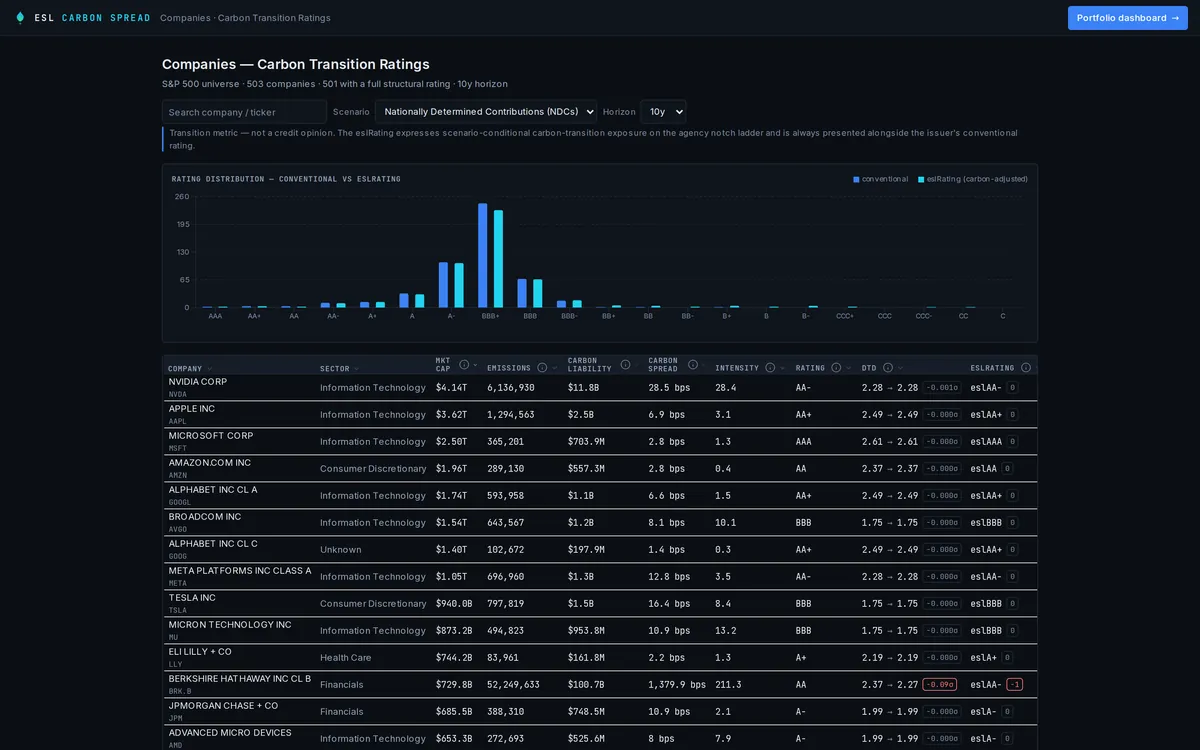
Where conventional ESG scores look backward, Carbon Spread runs equity portfolios through forward-looking transition scenarios, the seven NGFS Phase V pathways or your own, to estimate how current and future carbon liabilities bear on company valuations and cost of capital.
Weighted Average Carbon Spread
WACS = Σ wi × ( Ei × Pi ⁄ MCapi ) × 104
Result in basis points of value: the effect of a company’s current emissions on its equity valuation.
NGFS Phase V scenarios
Horizons1y3y5y10y30y
Asset-level emissions from Climate TRACE, attributed to issuers through documented ownership chains; validated science-based targets; reference emissions-trading prices; and issuers resolved against standard legal-entity and securities identifiers. Every figure on the dashboard shows its source, vintage and method.
Climate TRACENGFS Phase VSBTiICAPGLEIFOpenFIGI
Open data. Published standards. An annual cadence.
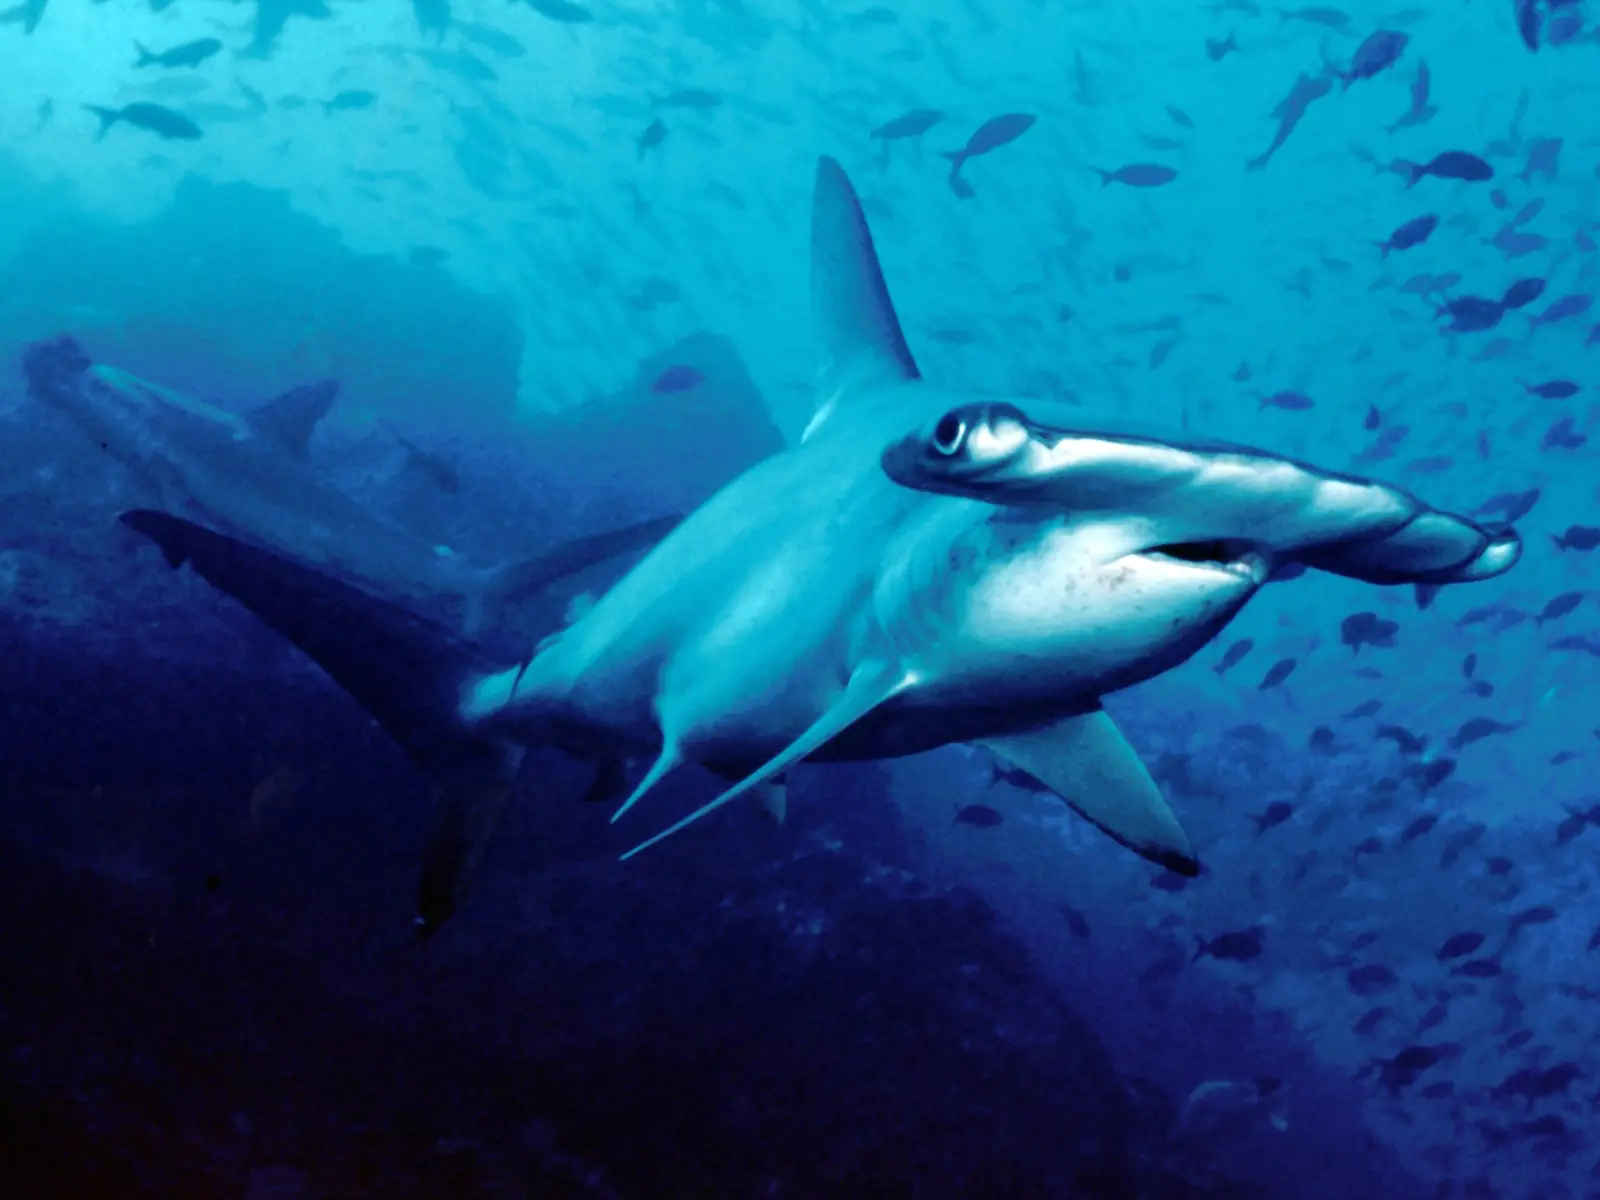
Scalloped hammerheads · Cocos Island, Costa Rica, one of the six MRV pilot areasBarry Peters · CC BY 2.0
07Key materials
Two short films walk through MAAP and MRV on the live tools. The Annual Ratings Study and the platforms are available on request.
08About
Carbon markets showed what happens when capital moves before standards: weak integrity, slow adoption, lost trust. Natural Capital Reserve was founded to build the rating and measurement discipline first, so that finance for marine biodiversity can scale on evidence.
Founded by Dr Shandi Modi to give carbon and environmental assets the accounting and risk tools institutional investors require. The agency enlisted Lord Stern as an advisor, Ian Johnson, then the World Bank’s Vice President for Sustainable Development, as co-founder, and Christiana Figueres as Vice Chair of its ratings committee.
The Carbon Ratings Agency rated and created financial mechanisms for climate initiatives. Beneficiaries of its work include the State of Gujarat in India, the R20 Regions of Climate Action founded by Arnold Schwarzenegger, the UN Global Compact on carbon pricing, and the World Bank Group on linking regional carbon-trading schemes and the International Carbon Reserve.
Founded to apply the same discipline to marine biodiversity and the 30×30 goal of the Kunming-Montreal Global Biodiversity Framework. Baseline assessment of 192 jurisdictions, November 2023.
Sovereign marine biodiversity ratings launched in February 2024.
First MAAP Annual Ratings Study, September 2026. MRV pilots scored in six marine areas. ESL Carbon Spread live on carbonspread.com.
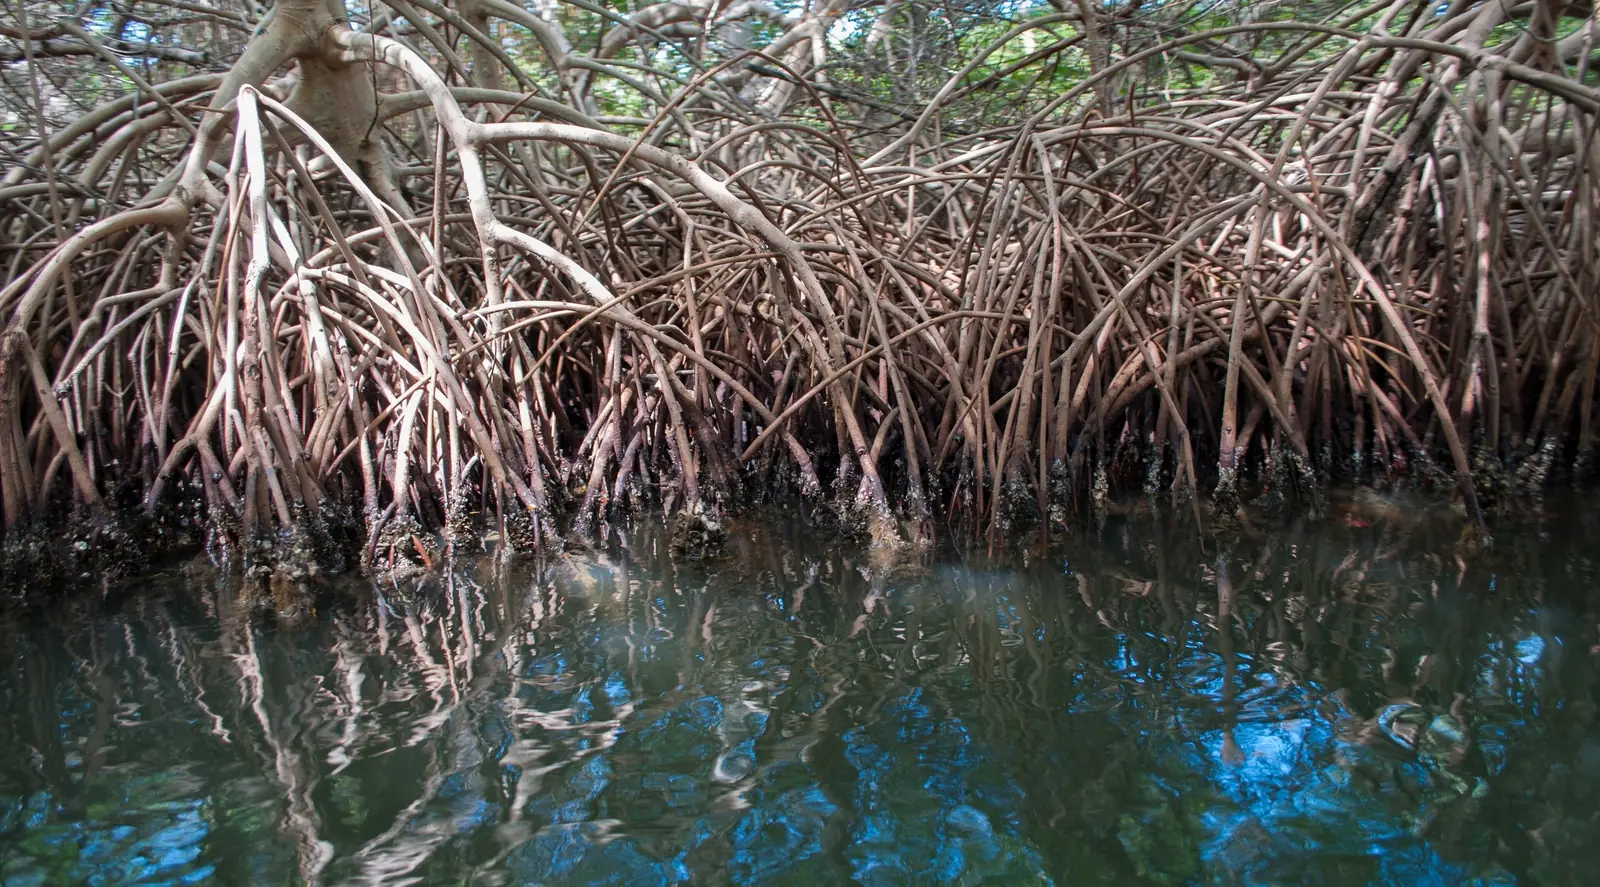
Mangrove roots · Laguna de La Restinga National Park, VenezuelaWilfredor · CC0
09Team

Co-Founder & CEO
Two decades across carbon, climate and biodiversity finance, at policy level and in building products that bring private capital in. Founder of IDEAcarbon Group and The Carbon Ratings Agency, conceived in 2007 on a simple premise: environmental assets need accounting and risk tools to the standard of any other asset class before institutional investors can deploy capital against them. The Carbon Ratings Agency rated and created financial mechanisms for climate initiatives. Beneficiaries of its work include the State of Gujarat in India, the R20 Regions of Climate Action founded by Arnold Schwarzenegger, the UN Global Compact on carbon pricing, and the World Bank Group on linking regional carbon-trading schemes and the International Carbon Reserve.
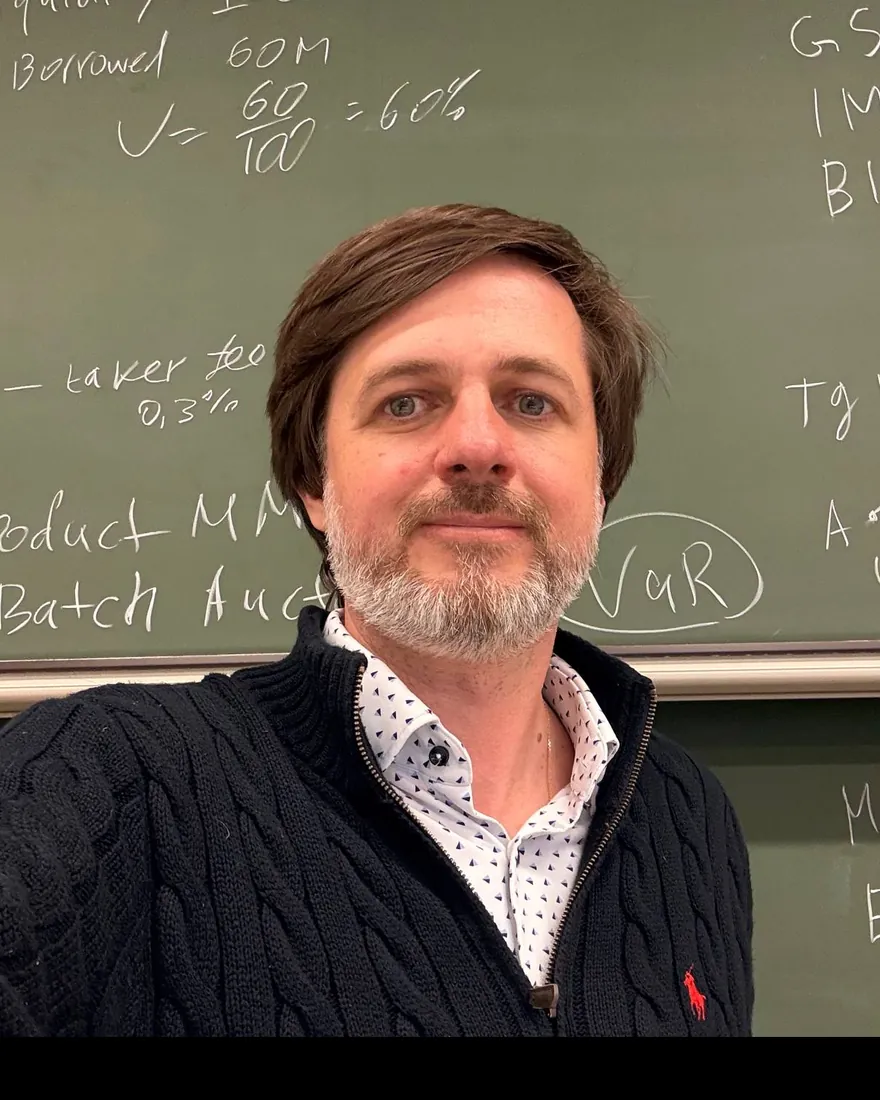
Partner, Product & Technology
A quantitative-finance specialist and technologist with a PhD in Mathematical Economics and more than fifteen years building data, modelling and market infrastructure across climate and capital markets. Leads the AI strategy and development of the rating systems, analytics and platforms behind MAAP, MRV and Carbon Spread. Founder and Board Chair of Vlinder, a nature-based carbon project developer with blue-carbon projects in Kenya, Indonesia and Brazil; previously a co-founder of the fintech firm Lykke. Teaches blockchain, risk and quantitative methods at HEC Lausanne and the New Economic School.
10Contact
Tell us which waters, protected area or portfolio you have in mind. We will come back with what MAAP, MRV or Carbon Spread can show for it, and how an assessment would work.